A team takes 20 shots and loses 1–0. Another team scores three goals from just four attempts. Which team created the better chances?
The final score tells us who won. But it does not always tell us how the match unfolded.
To understand what happens beyond the scoreline, we need to answer a simple question: What is xG in football?
Expected goals (xG) helps measure the quality of the chances a team creates.
Table of Contents
What Is xG in Football and How Does It Work?
xG stands for expected goals. It is a statistical measure of how likely a shot is to result in a goal, based on the characteristics of similar attempts in historical football data.
Each shot receives a value between 0 and 1.
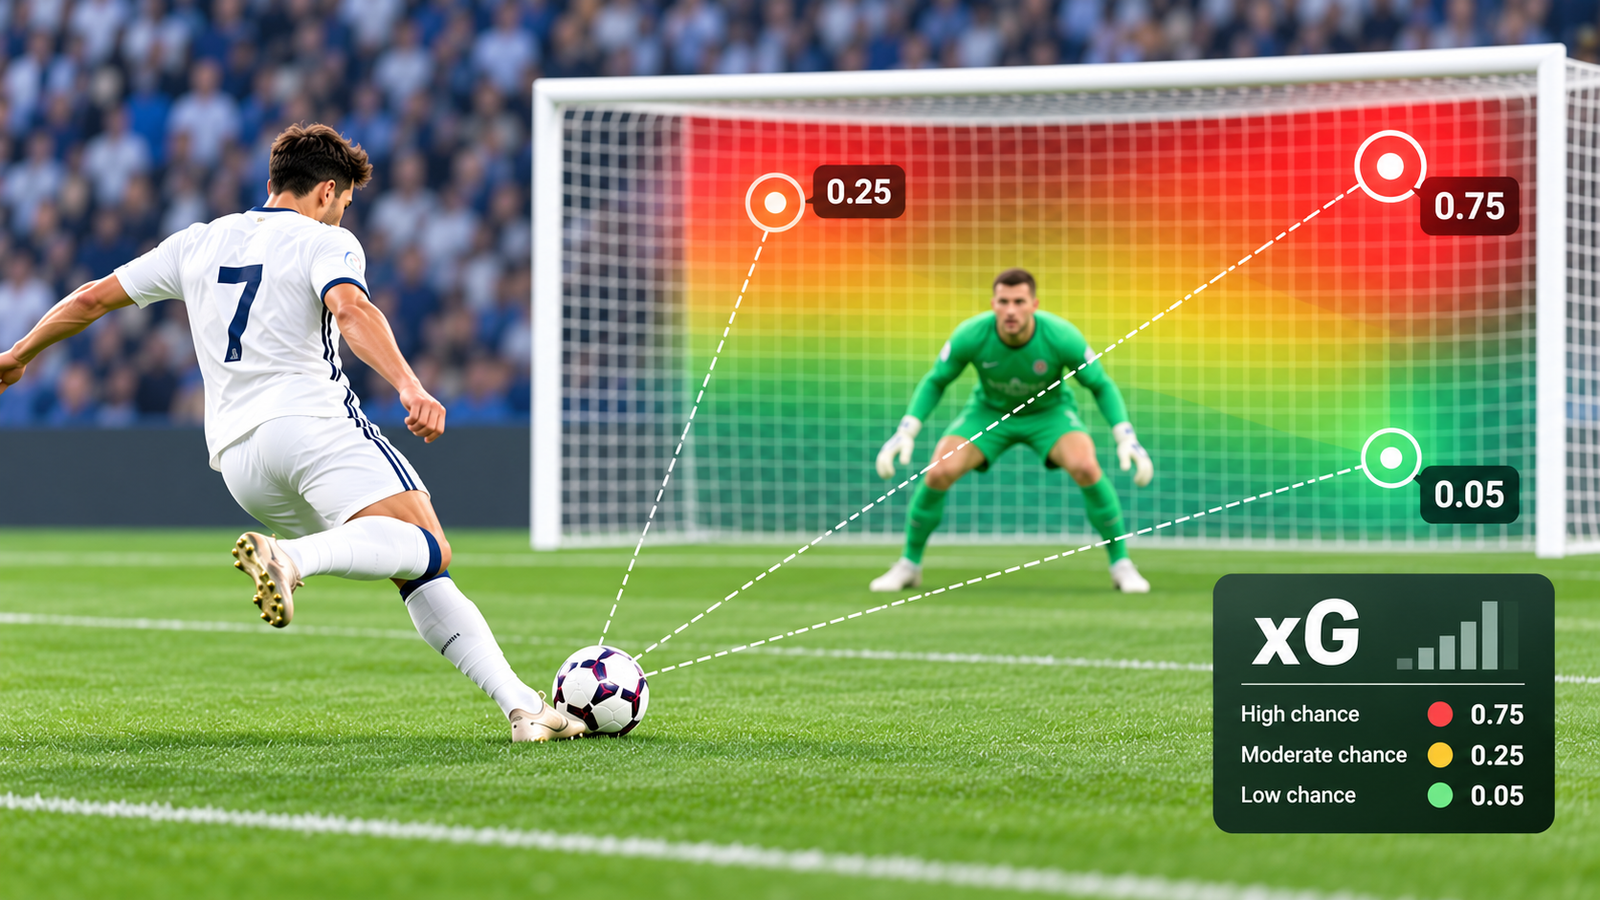
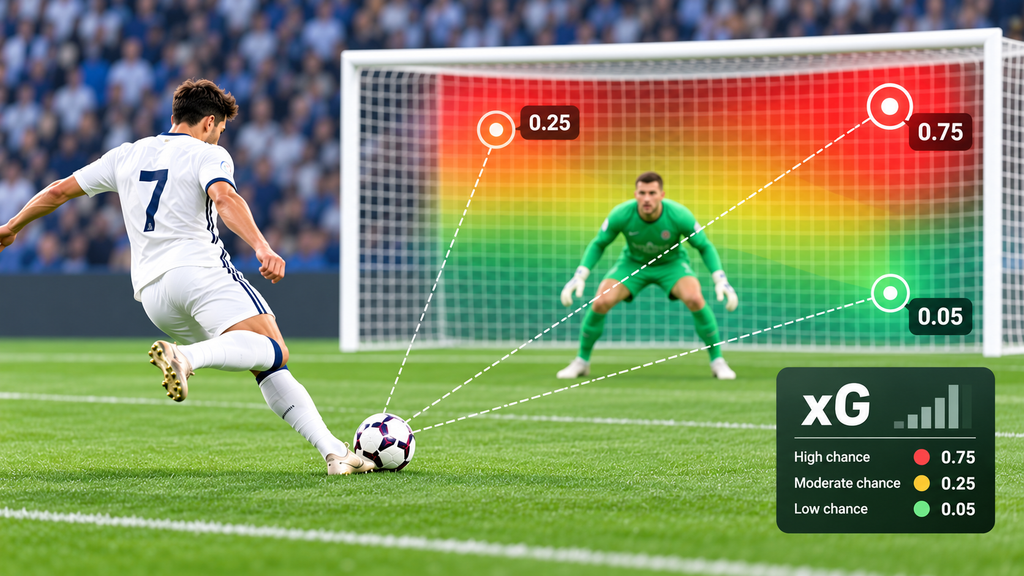
- 0.05 xG: A chance with an estimated 5% probability of becoming a goal.
- 0.25 xG: A chance with an estimated 25% probability.
- 0.75 xG: A chance with an estimated 75% probability.
A shot worth 0.25 xG does not mean a quarter of a goal has been scored. It means a model estimates that similar chances are converted approximately one time in four.
Add the values of a team’s shots together, and you get its total expected goals.
How Is xG Calculated?
Expected goals models are trained on large collections of previous shots. They identify patterns in the situations that tend to produce goals.
The exact inputs depend on the data provider, but common factors include:
1. Distance from Goal
Generally, shots taken closer to the goal have a higher probability of going in.
A shot from six yards is usually more dangerous than one from 30 yards.
2. Shooting Angle
A player shooting from directly in front of goal typically has a better opportunity than a player attempting a shot from a tight angle.
3. Type of Attempt
A header and a shot taken with the foot may have different probabilities, even from similar positions.
4. Type of Assist
Some models consider how the chance was created, including whether the ball arrived through a cross, a through ball, or another type of pass.
5. Defensive Context
More detailed models may also consider defenders’ positions and pressure on the shooter, depending on the data available.
Important: Different providers use different models. As a result, the same shot may receive slightly different xG values on different websites.
A Simple xG Example
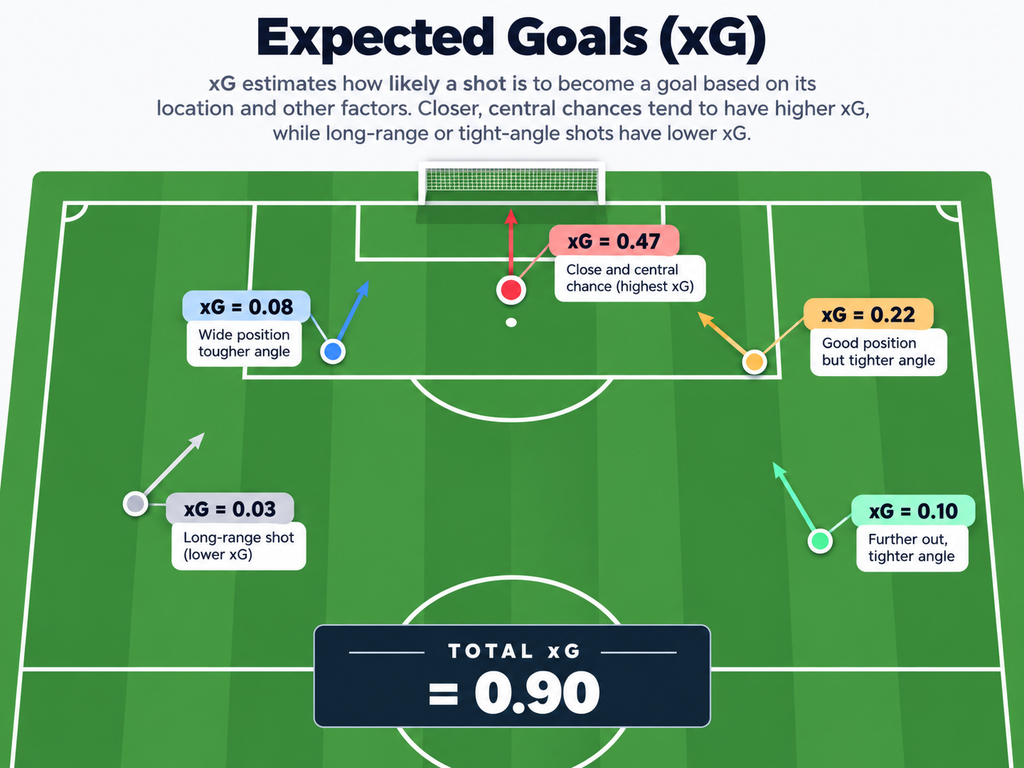
Imagine a team takes the following five shots during a match.
| Shot | Chance description | xG |
|---|---|---|
| 1 | Long-range attempt | 0.03 |
| 2 | Shot from the edge of the box | 0.08 |
| 3 | Central chance inside the box | 0.22 |
| 4 | Close-range opportunity | 0.47 |
| 5 | Header from a difficult angle | 0.10 |
| Total | 0.90 |
These figures are hypothetical examples, not values from a real match or a specific xG provider.
The team’s total is 0.90 xG.
This means its five attempts had a combined expectation of 0.90 goals according to our hypothetical model.
The team might still score zero, one, two, or more goals. Expected goals describes probabilities, not guaranteed outcomes.
Does Higher xG Mean a Team Deserved to Win?
Not necessarily.
Imagine this match:
| Statistic | Team A | Team B |
|---|---|---|
| Shots | 18 | 7 |
| Expected goals | 2.4 | 0.8 |
| Actual goals | 1 | 2 |
Team A created chances with a substantially higher total goal expectation. However, Team B won 2–1.
There are several possible explanations. Team A may have missed good chances, Team B may have finished difficult opportunities, or the goalkeeper may have made important saves.
The key distinction is:
The score measures what happened. xG estimates the quality of the chances created.
Both matter when evaluating a performance.
Why Can a Team Score More Goals Than Its xG?
When a player scores 15 goals from 11 xG, they have scored four more goals than their modelled expectation.
This is sometimes described as overperforming xG.
Possible explanations include exceptional finishing, difficult goals being converted, or normal statistical variation.
However, a positive difference over a small number of matches does not automatically establish that a player is an elite finisher. Longer samples and additional context are useful.
The opposite is also true. Scoring fewer goals than expected does not always mean a player is poor at finishing.
What Is the Difference Between xG and xGOT?
You might also encounter xGOT, short for expected goals on target.
The two metrics measure different things.
| Metric | What it measures |
|---|---|
| xG | The estimated quality of a scoring chance, generally assessed using information available before the shot’s outcome |
| xGOT | The estimated likelihood of an on-target shot becoming a goal, incorporating where the shot is placed |
A difficult chance might have an xG of 0.08. If the player strikes an outstanding shot toward the top corner, its xGOT could be much higher.
This distinction can help analysts evaluate both shooting execution and goalkeeping performances.
What Are the Limitations of xG?
Expected goals is useful, but it does not explain everything.
It does not capture every attacking threat. A dangerous passing move that never produces a shot may generate no xG.
Models are not identical. Two football statistics providers may assign different values to the same match.
One match is a small sample. A single game’s xG can be informative, but it is not a definitive assessment of which team is better.
It does not replace watching the game. Tactical decisions, player movement, defensive positioning, and game state still matter.
The most useful approach is to read xG alongside shots, shot locations, goals, tactical context, and the actual match.
Frequently Asked Questions
Is 1.0 xG equal to one guaranteed goal?
No. It means the combined chances have an expected value of one goal. The actual result may be higher or lower.
Can a team score three goals from 0.5 xG?
Yes. It is possible for several relatively low-probability chances to become goals. Unusual outcomes are part of football.
Is xG better than shots on target?
The metrics answer different questions. Shots on target measure how often a team tests the goal, while xG estimates the quality of its shooting opportunities.
Do penalties count toward xG?
Yes, penalties are included in many standard xG datasets, although the exact value and reporting conventions depend on the provider.
Why do different websites show different xG numbers?
Providers may use different historical datasets, modelling methods, and contextual information. When comparing figures, using the same provider consistently is best.
Final Thoughts
Expected goals has changed the way football performances are discussed.
Instead of focusing only on the number of shots or the final score, xG gives fans another way to understand the chances a team creates.
It does not reveal which team truly deserved to win, and it cannot explain every moment of a match. But used alongside the football itself, it offers a valuable perspective.
The scoreboard tells us the result. Expected goals helps us understand the opportunities behind it.